
Pedestrian fatalities at urban intersections have reached levels not seen in over four decades. An estimated 7,500 pedestrians were killed in traffic crashes in the most recent reporting year, representing a 77% increase from the decade prior (Governors Highway Safety Association). Understanding where, when, and why these fatalities occur is essential for both traffic safety planning and the legal landscape surrounding pedestrian injury claims.
Geographic Concentration of Fatalities
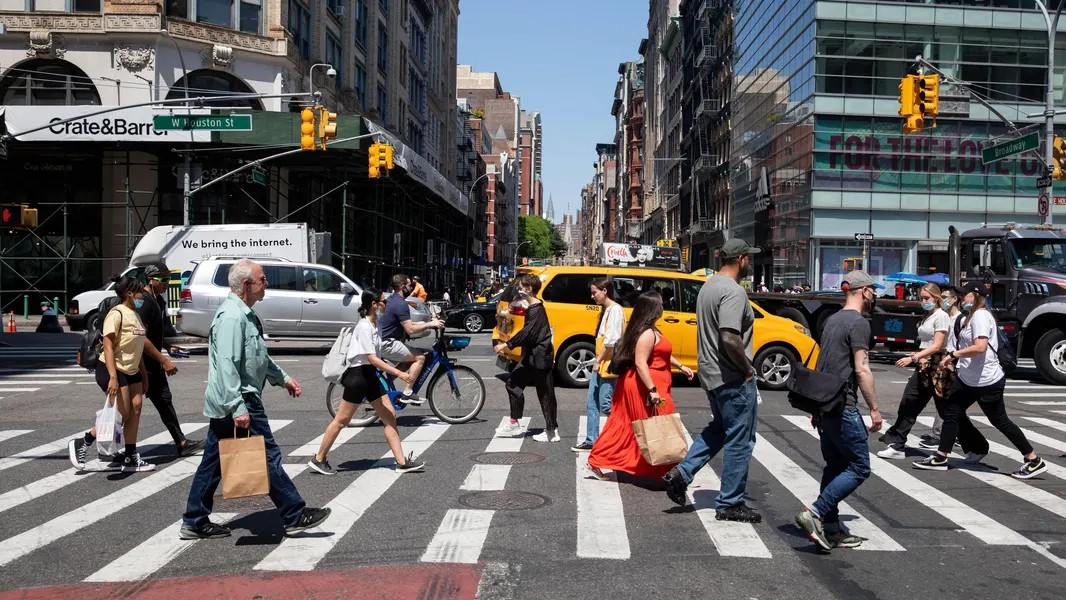
Pedestrian fatality data consistently shows geographic concentration. Approximately 75% of pedestrian deaths occur in urban areas, and within those areas, intersections account for a disproportionate share. An analysis of five years of federal crash data reveals that signalized intersections (Fatality Analysis Reporting System) with four or more approach lanes account for 34% of all urban pedestrian fatalities despite representing less than 15% of urban intersections by count.
California leads the nation in total pedestrian fatalities, with Los Angeles County alone averaging over 250 pedestrian deaths per year. The highest-fatality corridors in the county are characterized by wide, high-speed arterial roads, infrequent crosswalks, and limited pedestrian infrastructure. These design characteristics create conditions that legal analysis frequently identifies as contributing factors in negligence claims (Avian Law Group).
Time-of-Day and Lighting Patterns
Nearly 77% of pedestrian fatalities occur during low-light conditions, including nighttime, dawn, and dusk. The period between 6 PM and 9 PM accounts for the single largest share of fatal incidents. This pattern is consistent across all five years of data reviewed and holds across geographic regions, suggesting that visibility and lighting infrastructure play a central role in crash causation.
Intersections equipped with enhanced pedestrian-scale lighting show fatality rates approximately 42% lower than comparable intersections without such lighting, (Federal Highway Administration). This data point frequently becomes relevant in premises liability and municipal negligence analysis, where plaintiffs may argue that inadequate lighting constituted a known hazard that the responsible entity failed to address.
Speed as a Determinant of Outcome Severity
The relationship between vehicle speed and pedestrian fatality risk is exponential rather than linear. A pedestrian (AAA Foundation for Traffic Safety) (Accident Analysis and Prevention) struck by a vehicle traveling 23 miles per hour has a 10% risk of fatal injury. At 42 miles per hour, that risk increases to 50%. At 58 miles per hour, the fatality risk exceeds 90%.
This speed-fatality curve has direct implications for intersection design and posted speed limits on pedestrian-heavy corridors. It also informs legal analysis of accident severity. In cases where a driver was exceeding the posted speed limit at the time of a pedestrian collision, the speed data can establish the degree to which excess speed transformed a survivable impact into a fatal one.
Intersection Design and Legal Accountability
Intersection design features, including crosswalk visibility, signal timing, turning radius, and the presence of pedestrian refuge islands, directly influence fatality rates. Jurisdictions that have implemented road diet programs, converting four-lane roads to three lanes with dedicated turn lanes and wider sidewalks, have documented pedestrian fatality reductions averaging 29% on treated corridors. These design interventions and their documented effectiveness create a body of evidence that can establish whether a municipality met reasonable standards of care in maintaining safe pedestrian infrastructure.